4285ch02.fm Draft Document for Review May 4, 2007 11:35 am
66 Linux Performance and Tuning Guidelines
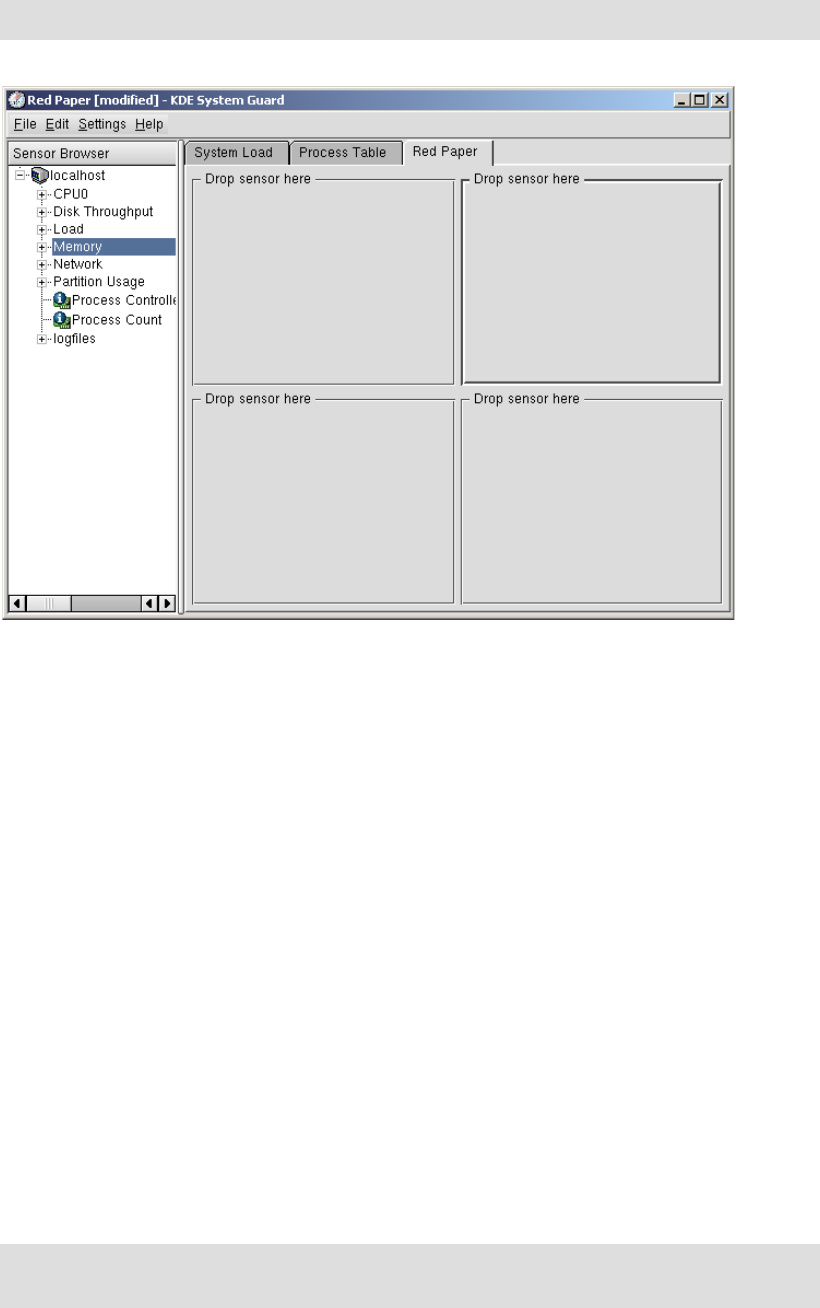
Figure 2-11 Empty worksheet
3. Fill in the sensor boxes by dragging the sensors on the left side of the window to the
desired box on the right. The types of display are:
– Signal Plotter: This displays samples of one or more sensors over time. If several
sensors are displayed, the values are layered in different colors. If the display is large
enough, a grid will be displayed to show the range of the plotted samples.
By default, the automatic range mode is active, so the minimum and maximum values
will be set automatically. If you want fixed minimum and maximum values, you can
deactivate the automatic range mode and set the values in the Scales tab from the
Properties dialog window (which you access by right-clicking the graph).
– Multimeter: This displays the sensor values as a digital meter. In the Properties dialog,
you can specify a lower and upper limit. If the range is exceeded, the display is colored
in the alarm color.
– BarGraph: This displays the sensor value as dancing bars. In the Properties dialog,
you can specify the minimum and maximum values of the range and a lower and upper
limit. If the range is exceeded, the display is colored in the alarm color.
– Sensor Logger: This does not display any values, but logs them in a file with additional
date and time information.
For each sensor, you have to define a target log file, the time interval the sensor will be
logged, and whether alarms are enabled.
4. Click File → Save to save the changes to the worksheet.
Note: The fastest update interval that can be defined is two seconds.
Note: When you save a work sheet, it will be saved in the user’s home directory, which may
prevent other administrators from using your custom worksheets.