ANALYTICAL METHODS FOR TEXTILE COMPOSITES
6-6
incorporated, laminate buckling is suppressed, regardless of the size of the delamination
(Section 4). Failure then reverts to kink band formation in in-plane tows or plies, which is
the desired mechanism of failure in a well designed 3D textile composite. Therefore, this
section focuses on predicting failure by kinking.
According to Argon’s Law, Eq. (4.1), estimates of compressive strength for
aligned loads can again be based on simple calculations of the local axial stress in aligned
tows for a given applied load, along with independent measurements of the critical shear
stress,
τ
c
, for axial shear flow within a tow and the distribution of the misalignment angle,
φ
. Measuring
τ
c
is relatively straightforward [6.1], but measuring the distribution of
φ
is
laborious and its prediction from models of the textile process is at present and probably
always will be impossible.
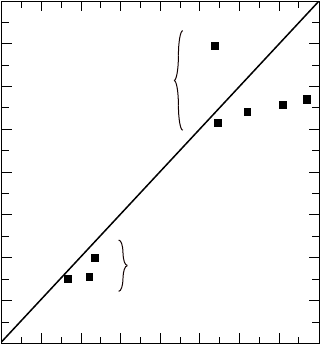
Whereas misalignment angles in tape laminates are typically 3° or less, they are
usually larger and subject to wider variations in textile composites. Some data for 3D
interlock weaves are shown in Fig. 6-1. Two groups of composites are represented, one
characterized by higher fiber volume fraction and higher degree of geometrical regularity,
which reflect superior textile processing methods [6.1]. In these better processed
composites, the maximum misalignment angles measured by destructive methods within
typical specimen gauge sections were approximately 3-5°. In the inferior composites, they
were approximately 8-11°. The measured compressive strengths were in inverse
proportion to the misalignment angles. Thus the critical local axial stress for kink band
formation could be predicted remarkably well by inserting the measured misalignment
angles and the measured value of
τ
c
into Eq. (4.1). Good estimates of composite strength
follow at once from the relation between the local and applied loads, which can be found
accurately enough by orientation averaging (isostrain) models.
SC.1339E.110294
800
700
600
500
400
300
200
100
0
0 100 200 300 400 500 600 700 800
Measured Peak Load (MPa)
Predicted Peak Load (MPa)
heavily
compacted
composites
lightly
compacted
composites
Figure 6-1. Measured compressive strengths of 3D interlock weaves compared with
predictions based on measurements of misalignment angles and the critical shear flow
stress (from [6.1] and [6.13]).
Knowledge of the distribution of misalignment angles and their control during
processing are obviously critical to compressive strength. Unfortunately, there are at